1. Overall Price Movement (2021 → 2026)
Key Insight:
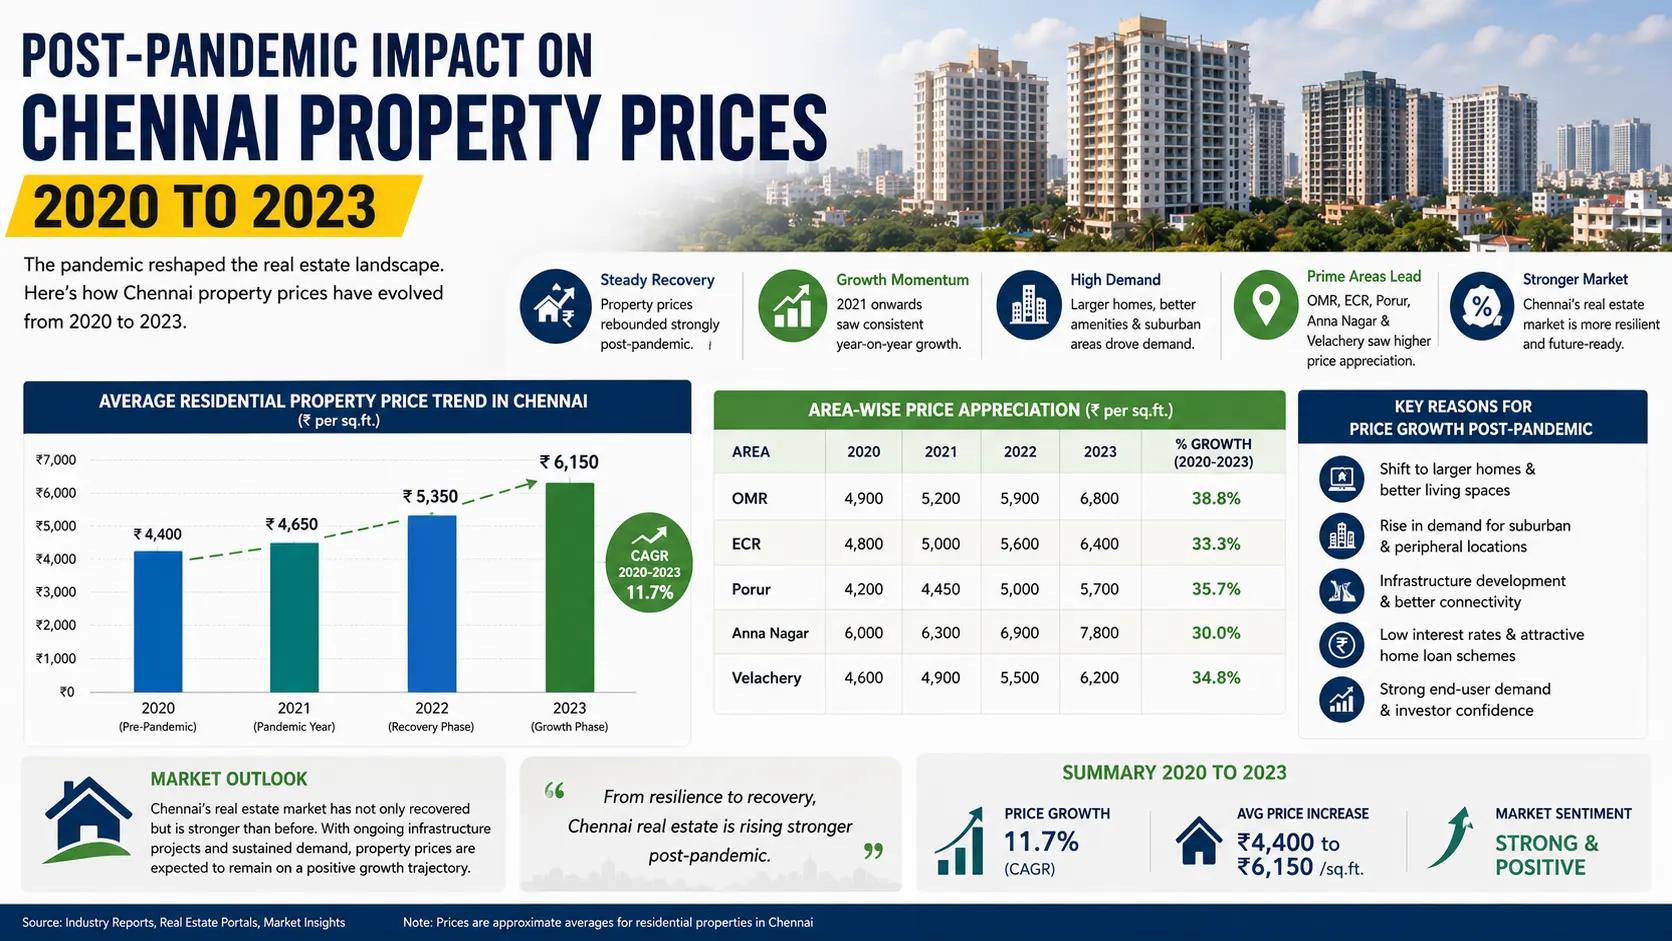
Between 2021 and 2026, Bangalore consistently outperformed Chennai in absolute price growth, while Chennai delivered slower but more stable appreciation.
City / Avg Price 2021 (Rs/sq ft) / Avg Price 2026 (Rs/sq ft) / 5-Year Growth
Chennai
- Rs 5,500 – Rs 6,000
- Rs 7,500 – Rs 8,200
- ~30–40%
Bangalore
- Rs 7,500 – Rs 8,500
- Rs 11,500 – Rs 12,500
- ~45–60%
Insight:
Bangalore’s prices grew faster due to aggressive demand pressure, while Chennai avoided sharp spikes and corrections.
2. Year-by-Year Price Behaviour Macro Trend
Chennai Price Behaviour
- 2021–2022: Flat to mild growth (post-COVID recovery phase)
- 2023–2024: Gradual acceleration driven by infrastructure execution
- 2025–2026: Stable upward movement, no speculative jump
Insight:
Chennai followed a linear growth curve, indicating an end-user-dominated market.
Bangalore Price Behaviour
- 2021–2022: Strong rebound after COVID
- 2023–2024: Demand surge from IT hiring & migration
- 2025–2026: Sharp YoY increases in multiple micro-markets
Insight:
Bangalore followed a stepped growth curve, with rapid jumps during high-demand phases.
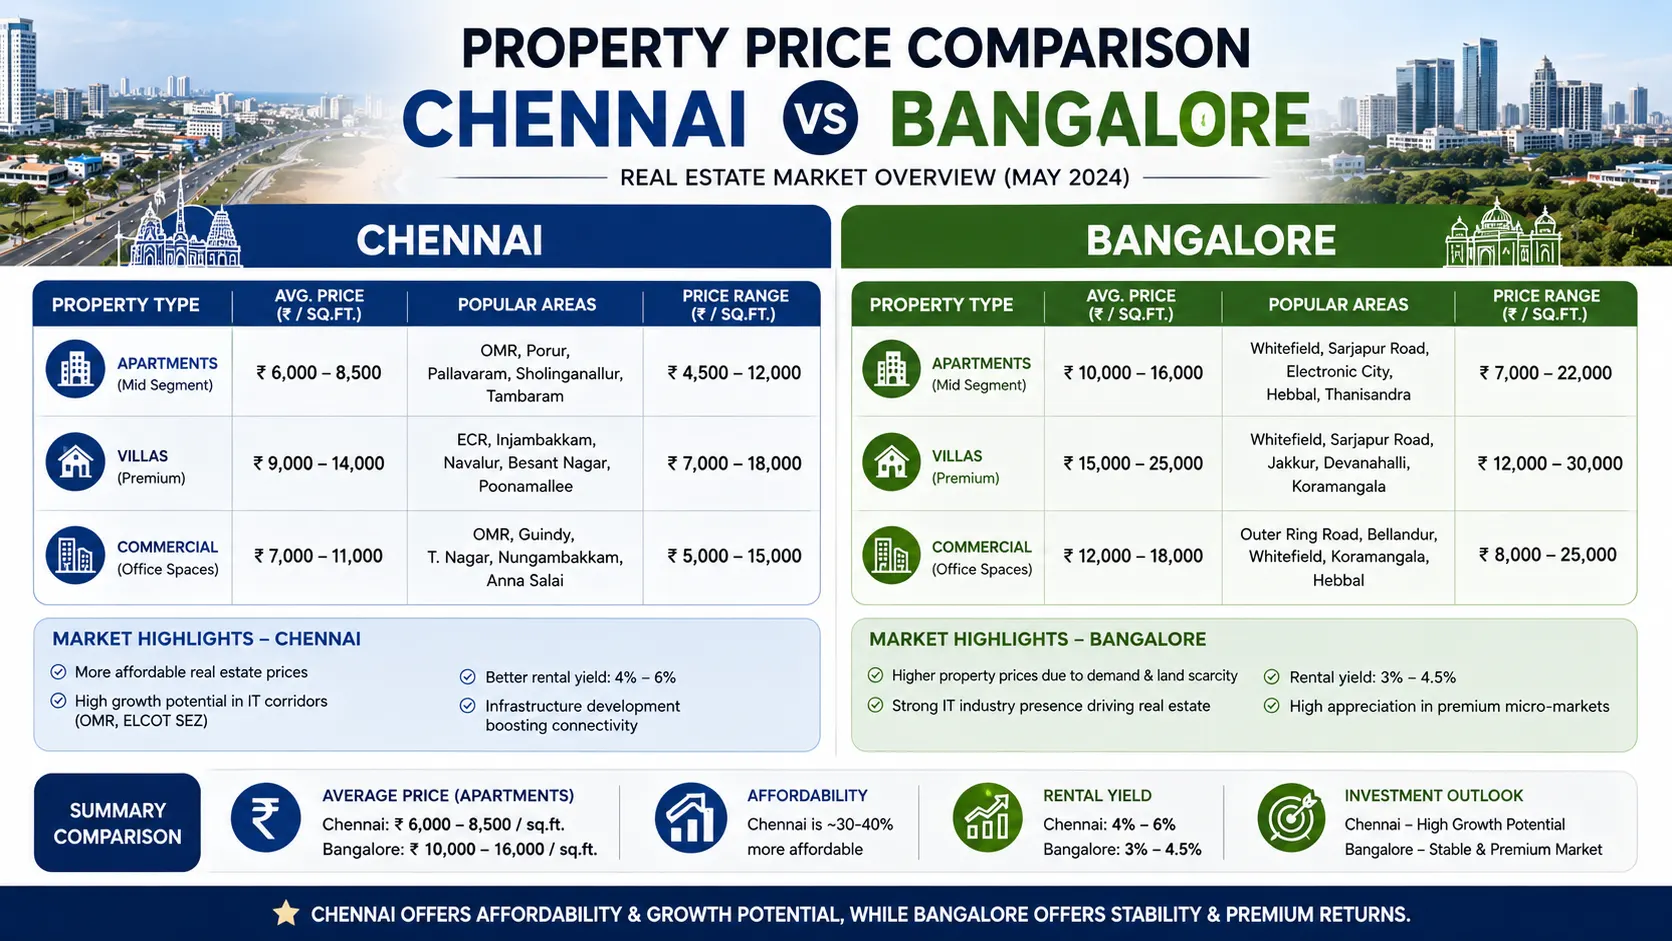
3. Price Distribution by Market Type 2026
Market Type / Chennai (Rs /sq ft) / Bangalore (Rs /sq ft)
Entry / Suburban
- 4,000 – 6,000
- 7,000 – 9,000
Mid-Segment
- 6,500 – 10,000
- 10,000 – 15,000
Premium
- 12,000 – 20,000+
- 15,000 – 25,000+
Insight:
Even Bangalore’s entry-level prices are close to Chennai’s mid-segment, creating a permanent affordability gap.
4. Price Gap Expansion 2021 vs 2026
- 2021 price gap: ~Rs 2,000/sq ft
- 2026 price gap: ~Rs 4,000–Rs 5,000/sq ft
Insight:
The gap more than doubled in 5 years, proving Bangalore’s faster capital absorption rate.
5. Demand Structure Impacting Prices
Chennai
- Demand dominated by local end-users
- High preference for ready-to-move homes
- Limited speculative buying
Price Effect:
- Lower volatility
- Predictable appreciation
- Strong downside protection
Bangalore
- Demand driven by IT migration, investors, NRIs
- Higher willingness to buy under-construction
- Faster resale cycles
Price Effect:
- Faster appreciation
- Higher entry cost
- Greater exposure to market cycles
6. Volatility & Risk Insight
- Chennai showed low price volatility across 2021–2026
- Bangalore experienced price acceleration phases, especially post-2023
Insight:
Chennai behaves like a low-risk compounding market, Bangalore like a high-growth momentum market.
7. Affordability Index (2026)
Metric / Chennai / Bangalore
Avg Home Size Affordable
- 1,100–1,400 sq ft
- 800–1,100 sq ft
EMI Pressure
- Moderate
- High
Buyer Stretch
- Lower
- Higher
Insight:
Chennai buyers get larger homes per rupee spent, Bangalore buyers pay a premium for employment access.
8. Market Insight 2021–2026
- Chennai rewarded patience and long-term holding
- Bangalore rewarded early entry and momentum timing
Insight:
Neither market underperformed — they performed differently due to buyer psychology and economic structure.
9. Conclusion
Chennai (2021–2026):
- Stable Rs/sq ft growth, controlled pricing, affordability-driven demand, low volatility.
Bangalore (2021–2026):
- Higher Rs/sq ft escalation, widening price gap, demand-driven inflation, stronger upside with higher risk.
Core Insight:
From 2021 to 2026, Bangalore became costlier faster, while Chennai became stronger steadily.