1. Chennai Residential Market: 20-Year Context
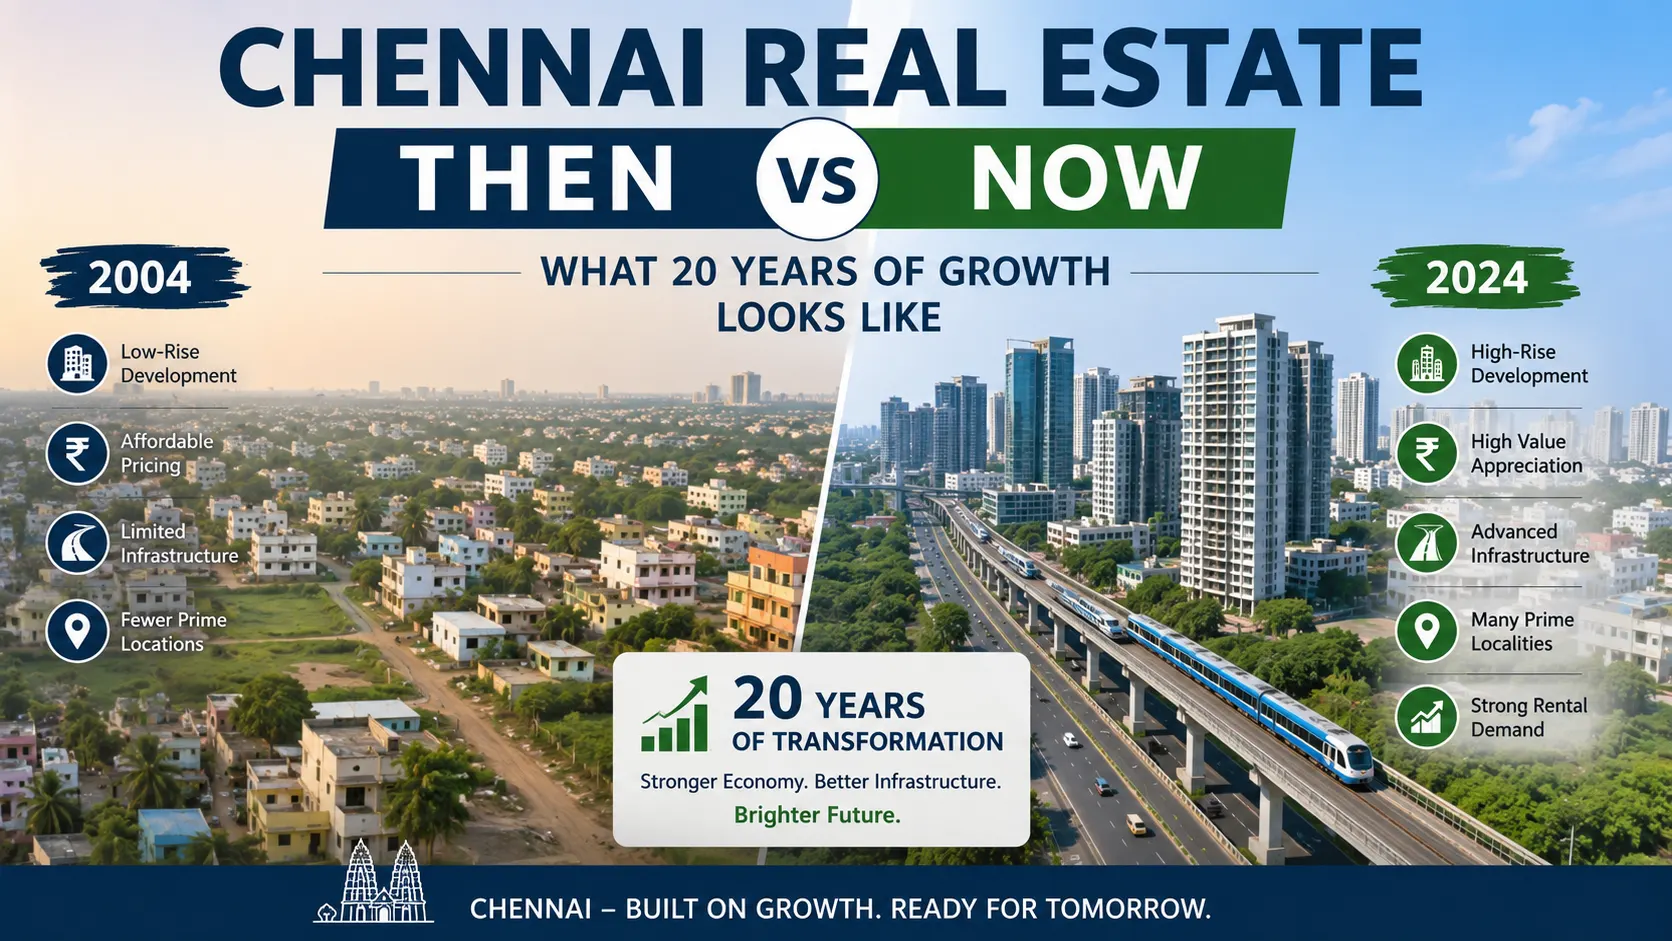
From 2006 to 2026, Chennai’s housing market evolved from low-rise, land-driven neighborhoods to high-density apartment corridors, especially along IT and infrastructure growth zones. Over two decades, land scarcity, metro expansion, IT employment, and urban sprawl became the dominant price drivers.
Core pattern over 20 years
- Land values compounded steadily across the city.
- Apartment prices grew fastest in the first 8–12 years, then moderated.
- Central and South Chennai consistently outperformed peripheral locations.
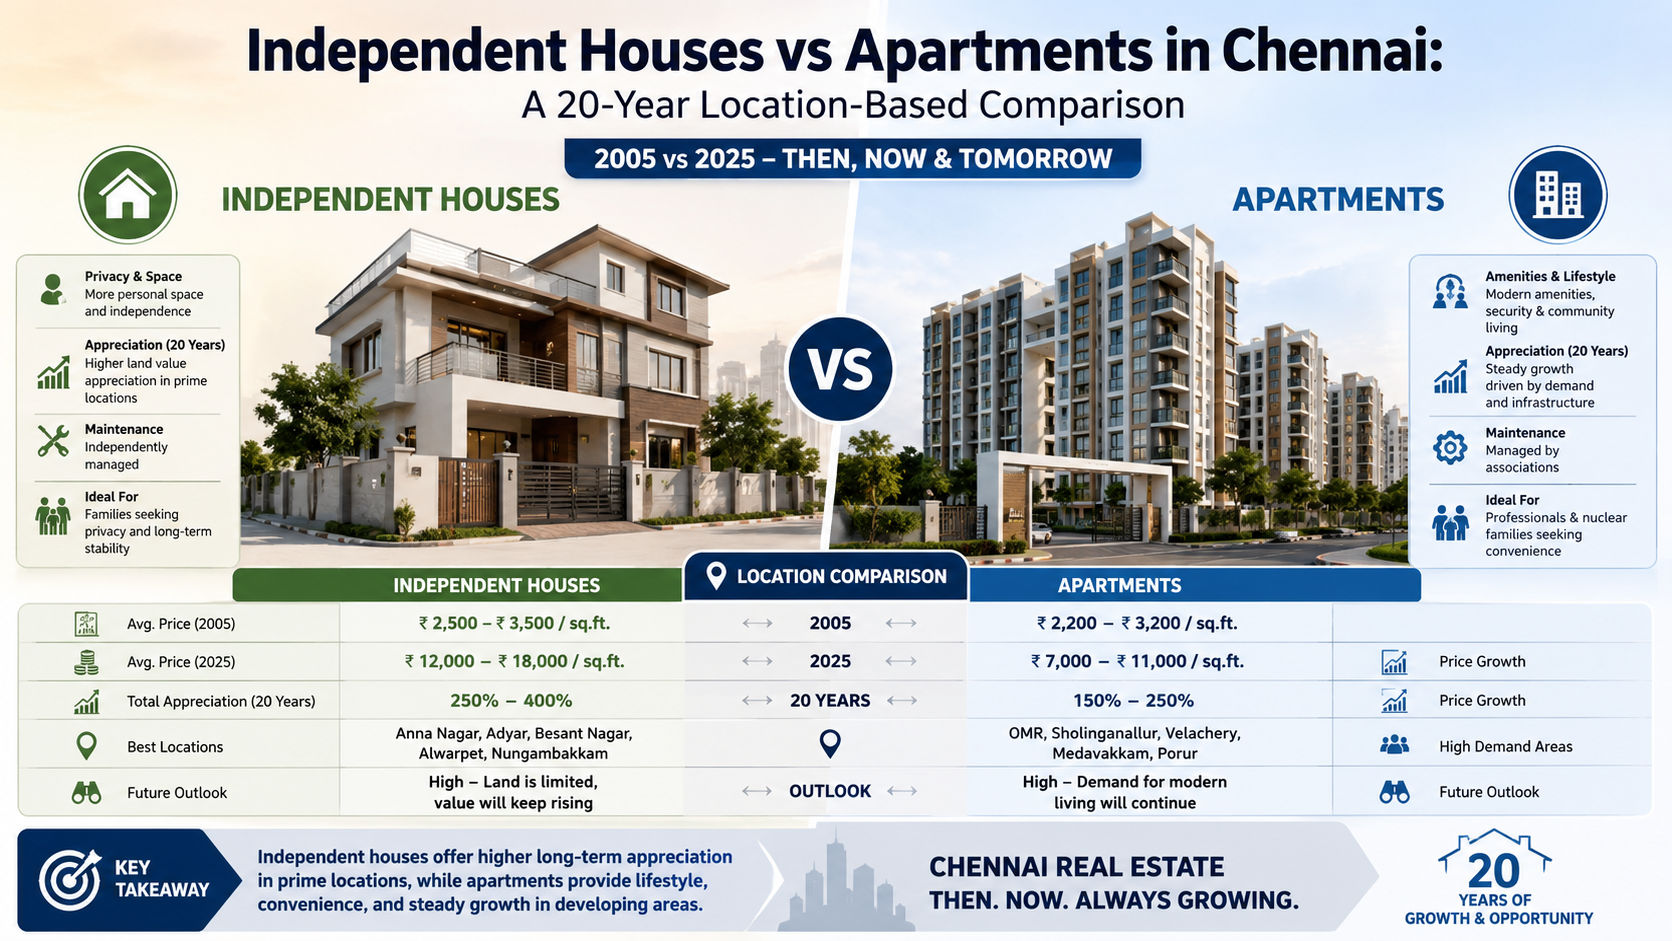
2. Independent Houses: Long-Term Performance
Structural Characteristics
- Full ownership of land and structure
- Value primarily derived from land (60–80%)
- Redevelopment and reconstruction flexibility
- Minimal common maintenance dependency
Why Independent Houses Appreciate Strongly
- Finite land supply in established localities
- Increasing demand for redevelopment plots
- Age of building does not significantly reduce land value
- Suitable for generational holding
3. Apartments: Long-Term Performance
Structural Characteristics
- Shared land ownership
- Value split between construction and land
- Dependence on building age, amenities, and maintenance
- High buyer and tenant demand in employment hubs
Why Apartment Appreciation Is Moderate
- Building depreciation begins after 12–15 years
- Continuous supply in IT corridors
- Value growth plateaus once the project ages
4. Location-Based Price Comparison (2006 vs 2026)
Independent Houses – Land Value Trend
Anna Nagar
- 2006 land Price - 3,500
- 2026 Land Price 22,000 – 25,000
Adyar
- 2006 Land Price - 4,000
- 2026 Land Price - 30,000 – 35,000
T. Nagar
- 2006 Land Price - 4,500
- 2026 Land Price - 32,000 – 38,000
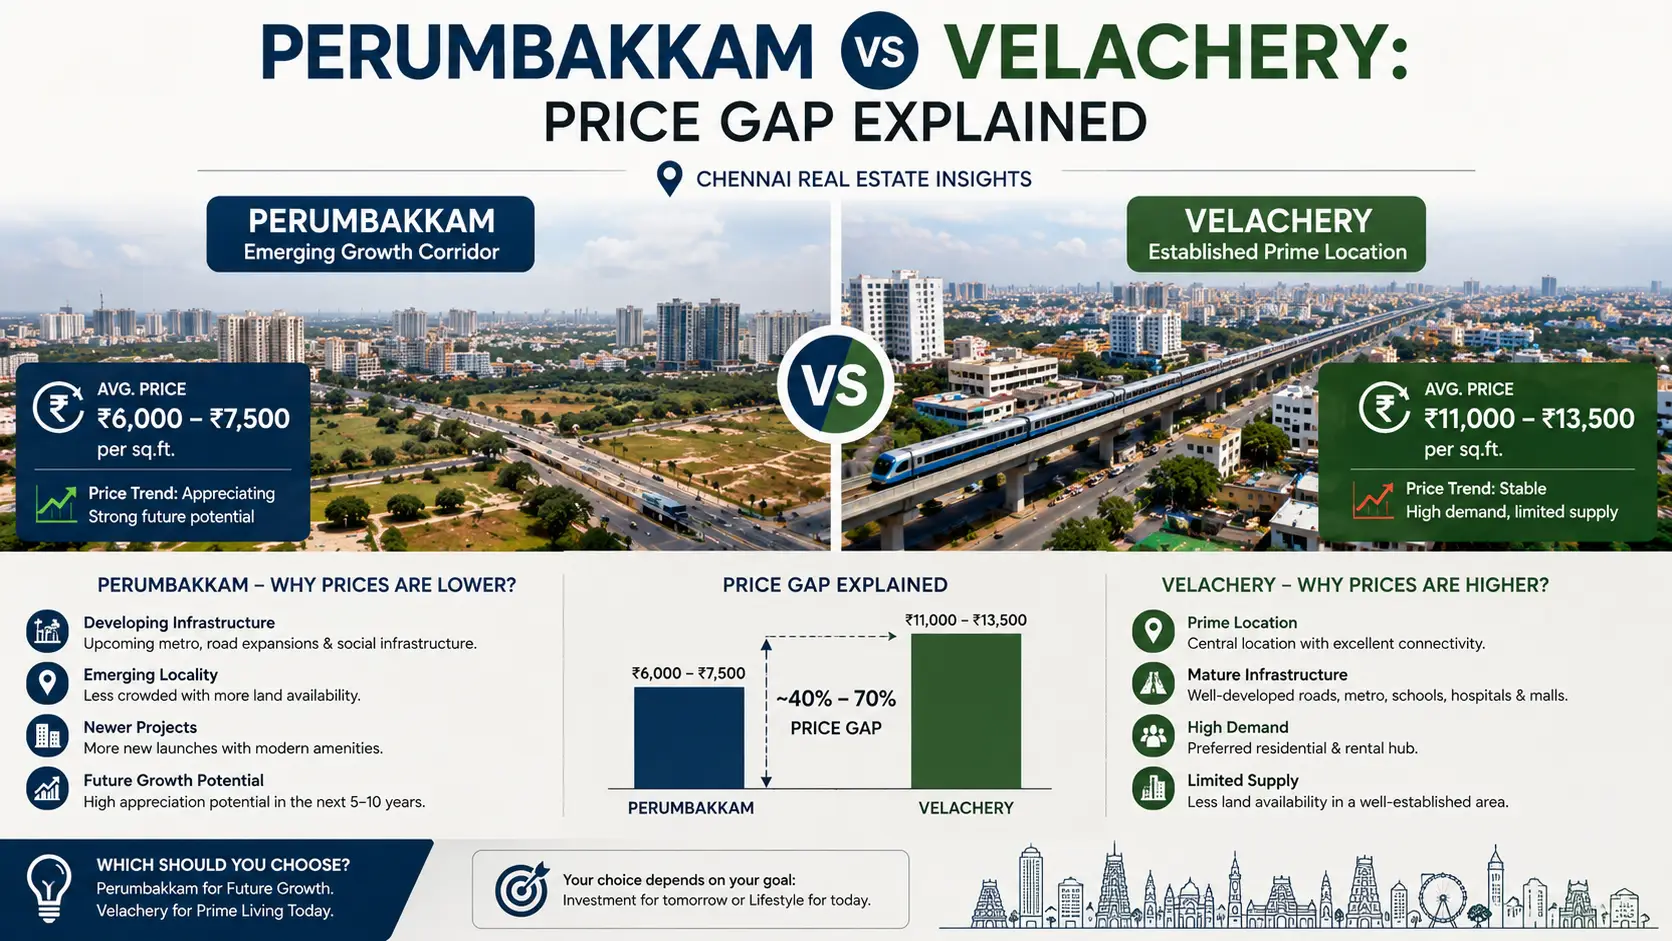
Velachery
- 2006 Land Price -1,200
- 2026 Land Price -9,000 – 11,000
Tambaram
2006 Land Price - 600
2026 Land Price - 5,000 – 6,000
Insight:
Even with modest annual growth, land prices multiplied 7–10 times over 20 years in most Chennai locations.
Apartments – Built-Up Price Trend
Location / 2006 Avg Price (Rs/sq.ft) / 2026 Avg Price (Rs/sq.ft)
Anna Nagar
- 4,000
- 13,000 – 15,000
Adyar
- 4,500
- 16,000 – 18,000
OMR
- 2,200
- 7,500 – 9,000
Porur
- 2,000
- 7,000 – 8,500
Tambaram
- 1,800
- 6,000 – 7,000
Insight:
Apartment prices typically 2.5x–3.5x over 20 years, lower than land-led growth.
4. Depreciation vs Appreciation Dynamics
Independent Houses
- Structure depreciates
- Land continues to appreciate
- Net asset value increases despite aging construction
Apartments
- Structure depreciates
- Land share is limited
- Market value becomes sensitive to age and maintenance quality
5. 20-Year Investment Outcome Example
Rs 1 Crore invested in 2006
Asset Type / Approx. Value in 2026
Independent House (Prime Location)
- Rs6 – Rs8 Crore
Apartment (Prime Location)
- Rs3 – Rs3.5 Crore
Apartment (Peripheral Location)
- Rs2.2 – Rs2.8 Crore
6. Location-Based Performance Summary
Central & South Chennai
- Independent houses show the highest wealth creation
- Apartments retain value but grow slower after maturity
IT & Growth Corridors
- Apartments deliver stable rental demand
- Land-led properties gain momentum after infrastructure maturity
Suburban Zones
- Independent houses outperform over long holding periods
- Apartments suit affordability and rental objectives
Conclusion
In Chennai’s long-term residential market, buildings age, but land compounds. Independent houses benefit from scarcity and redevelopment potential, while apartments provide liquidity and rental stability—each serving a distinct investment and living purpose over a 20-year horizon.
- Independent houses in Chennai are land investments with a structure attached
- Apartments are lifestyle and rental assets with limited land leverage
- Over 20 years, land ownership consistently outperforms built-up assets
- Apartments offer smoother cash flow; houses deliver stronger capital appreciation