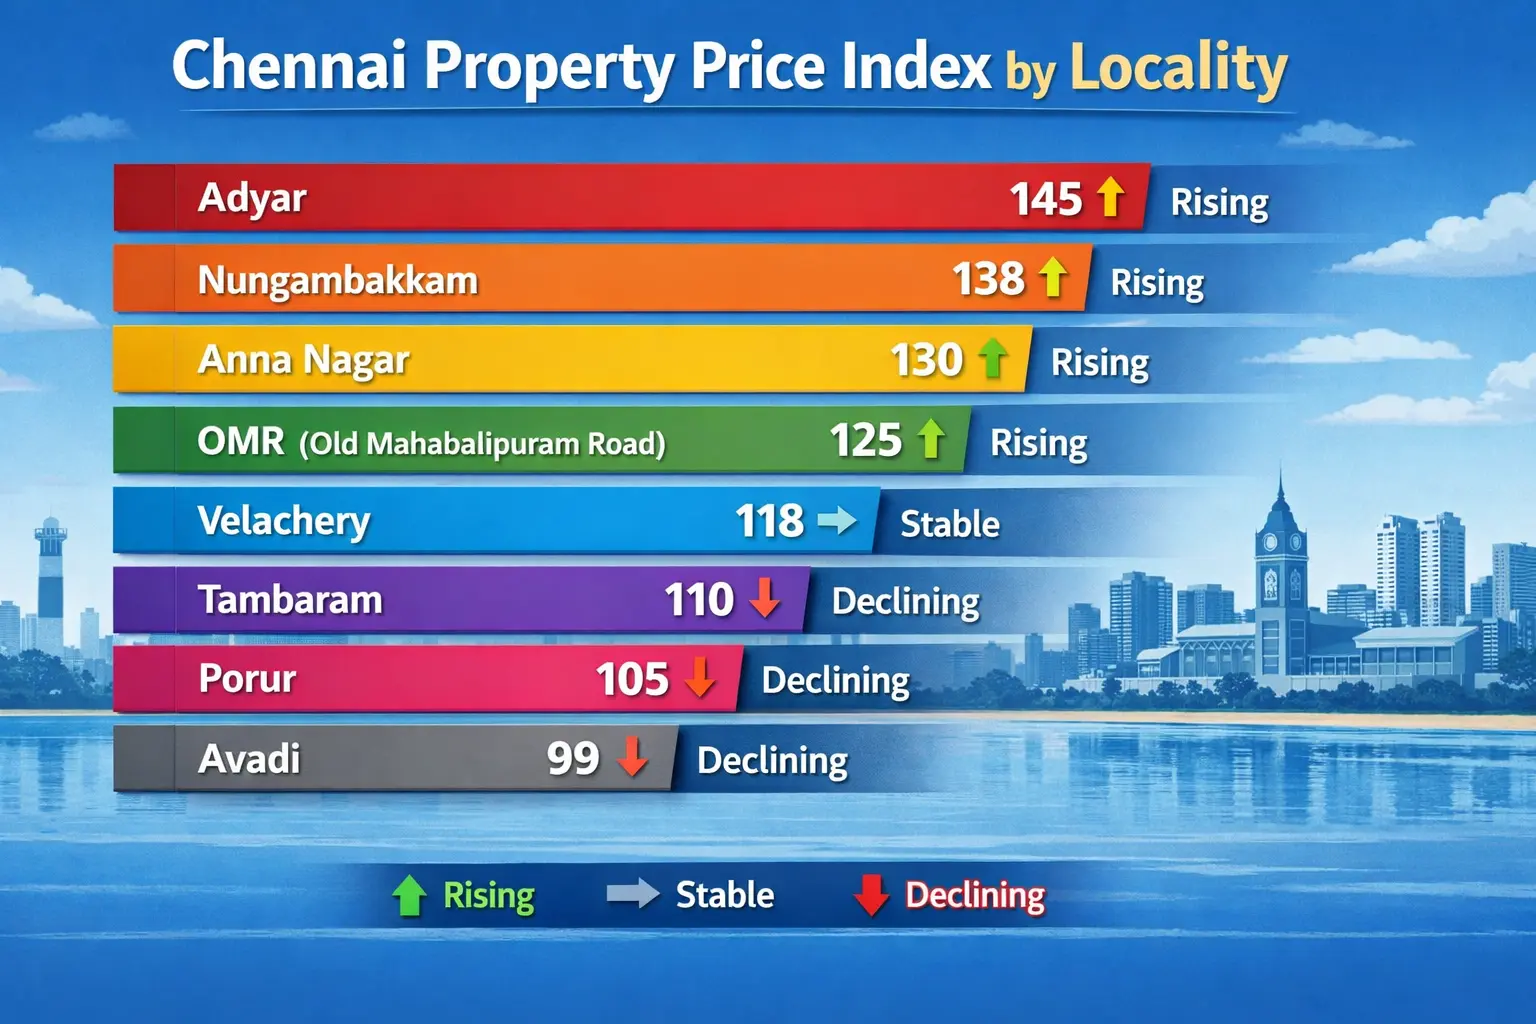
The property price index in Chennai reflects how residential prices (?/sq.ft) differ across neighbourhoods based on infrastructure maturity, connectivity, job proximity, and lifestyle profile. Chennai’s market is known for stable, end-user-driven pricing, so locality differences are very meaningful.
1. Premium & Established Residential Localities
- Price band: Rs 15,000 – Rs 20,000/sq.ft
- Index insight: One of the highest indices in Chennai due to limited land supply and long-established residential character.
- Price behaviour: Slow but consistent appreciation; prices rarely correct sharply.
- Demand driver: Families, senior professionals, long-term residents.
- Price band: Rs 12,000 – Rs 17,000/sq.ft
- Index insight: Strong and stable index supported by planned layout, wide roads, and complete social infrastructure.
- Price behaviour: Steady upward movement, largely insulated from market cycles.
- Demand driver: End-users with mid-to-high budgets.
- Price band: Rs 18,000 – Rs 22,000+/sq.ft
- Index insight: Among the highest in Chennai; reflects exclusivity and central location.
- Price behaviour: Low transaction volume but very high value per transaction.
- Demand driver: High-net-worth buyers and legacy property holders.
Overall insight (premium zones):
These localities form the top tier of the Chennai price index, marked by scarcity-driven pricing rather than rapid growth.
2. Mid-Segment & Growth-Oriented Localities
- Price band: Rs 9,000 - Rs 12,000/sq.ft
- Index insight: Transitional zone between core city and IT corridor; prices reflect both residential demand and congestion challenges.
- Price behaviour: Moderate appreciation with short-term fluctuations.
- Demand driver: Working professionals and families seeking city access.
- Price band: Rs 6,000 – Rs 8,000/sq.ft
- Index insight: Rising index due to proximity to industrial hubs and improving road connectivity.
- Price behaviour: Gradual upward trend with periodic jumps after infrastructure upgrades.
- Demand driver: Budget-conscious end-users and mid-income households.
Overall insight (mid-segment):
These areas show balanced price indices, combining affordability with reasonable appreciation potential.
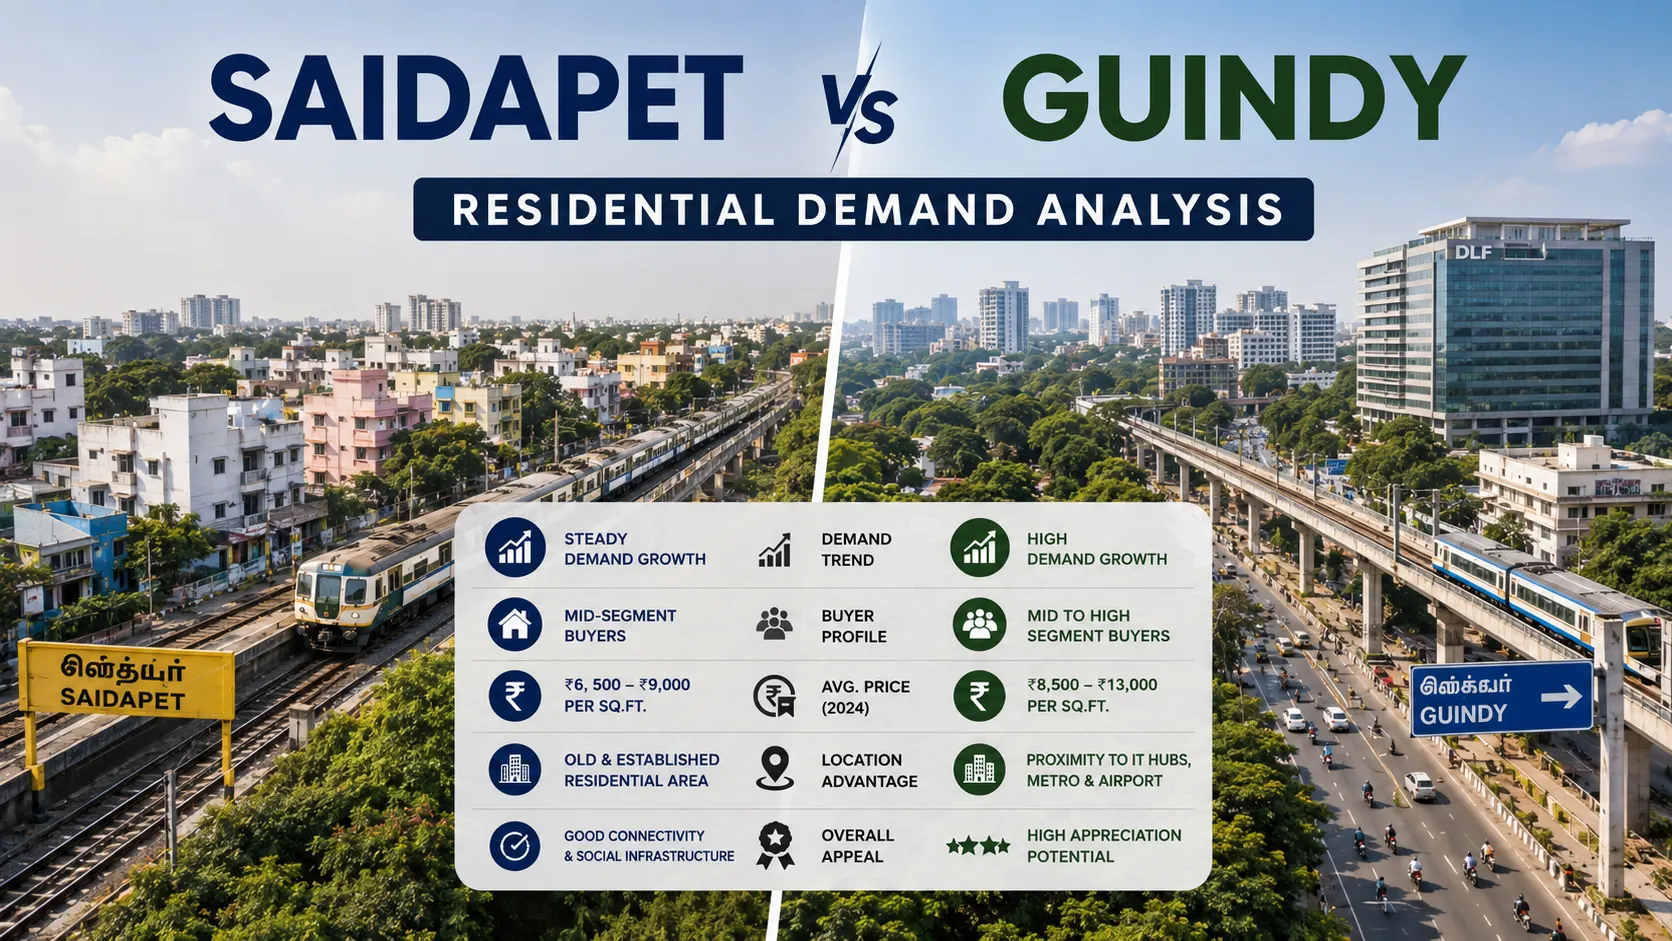
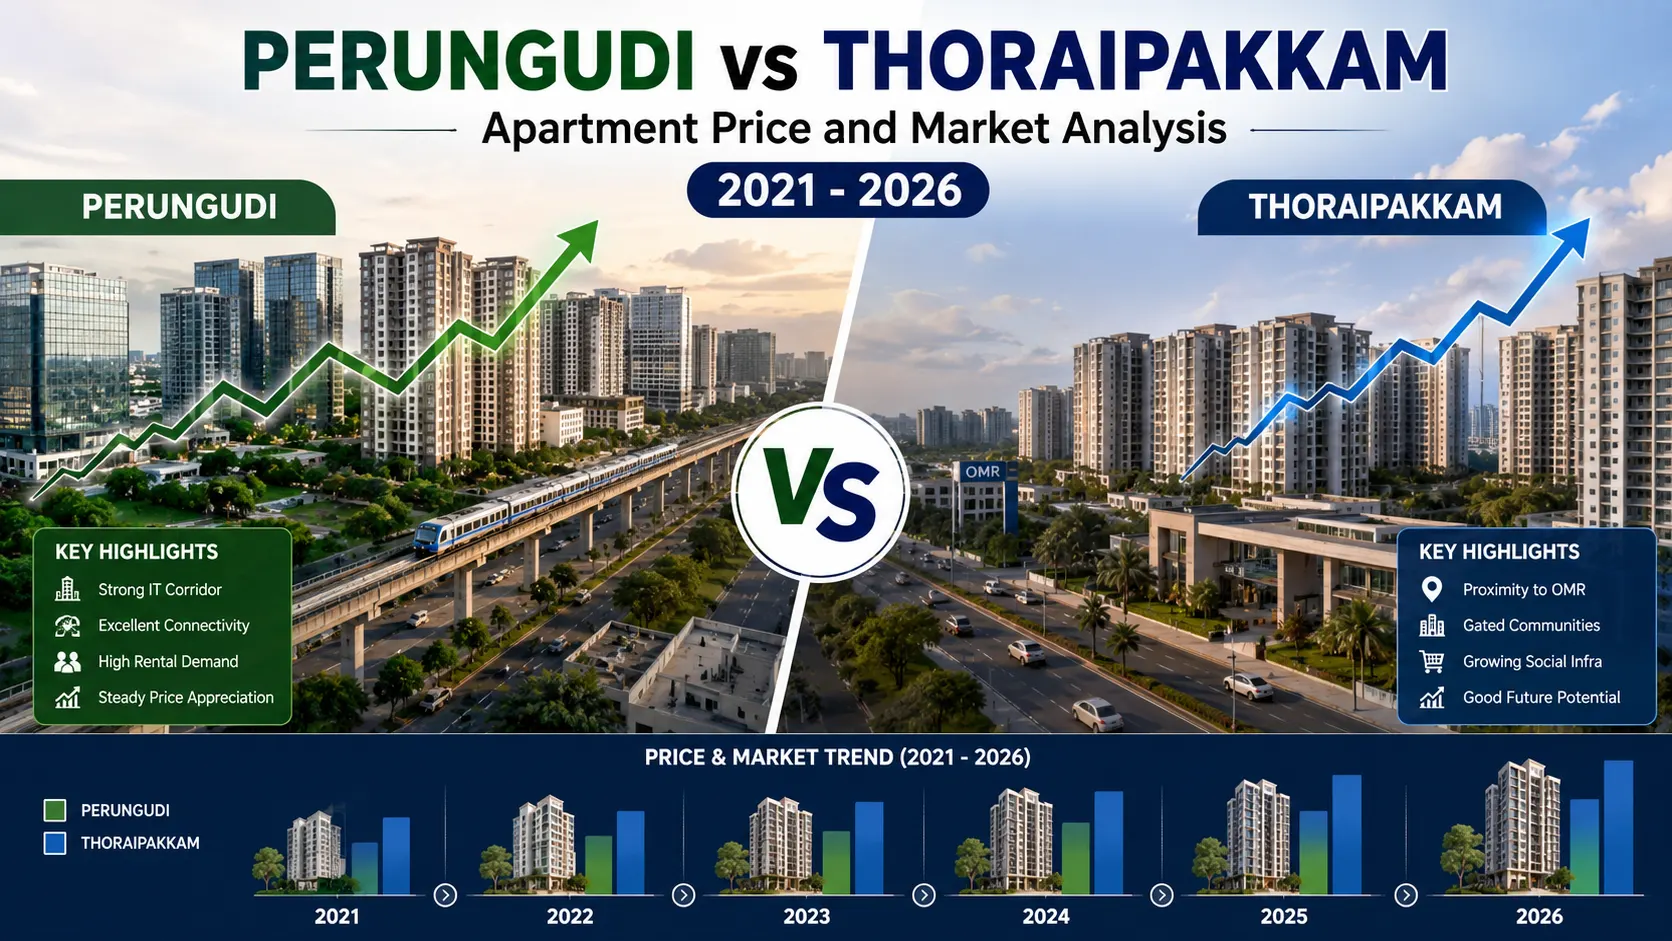
3. IT Corridor & Employment-Driven Localities
OMR
- Price band: Rs 7,000 – Rs 9,000/sq.ft
- Index insight: One of the most dynamic indices in Chennai, closely linked to IT employment growth.
- Price behaviour: Strong long-term appreciation; short-term volatility based on supply cycles.
- Demand driver: IT professionals, investors, and rental demand.
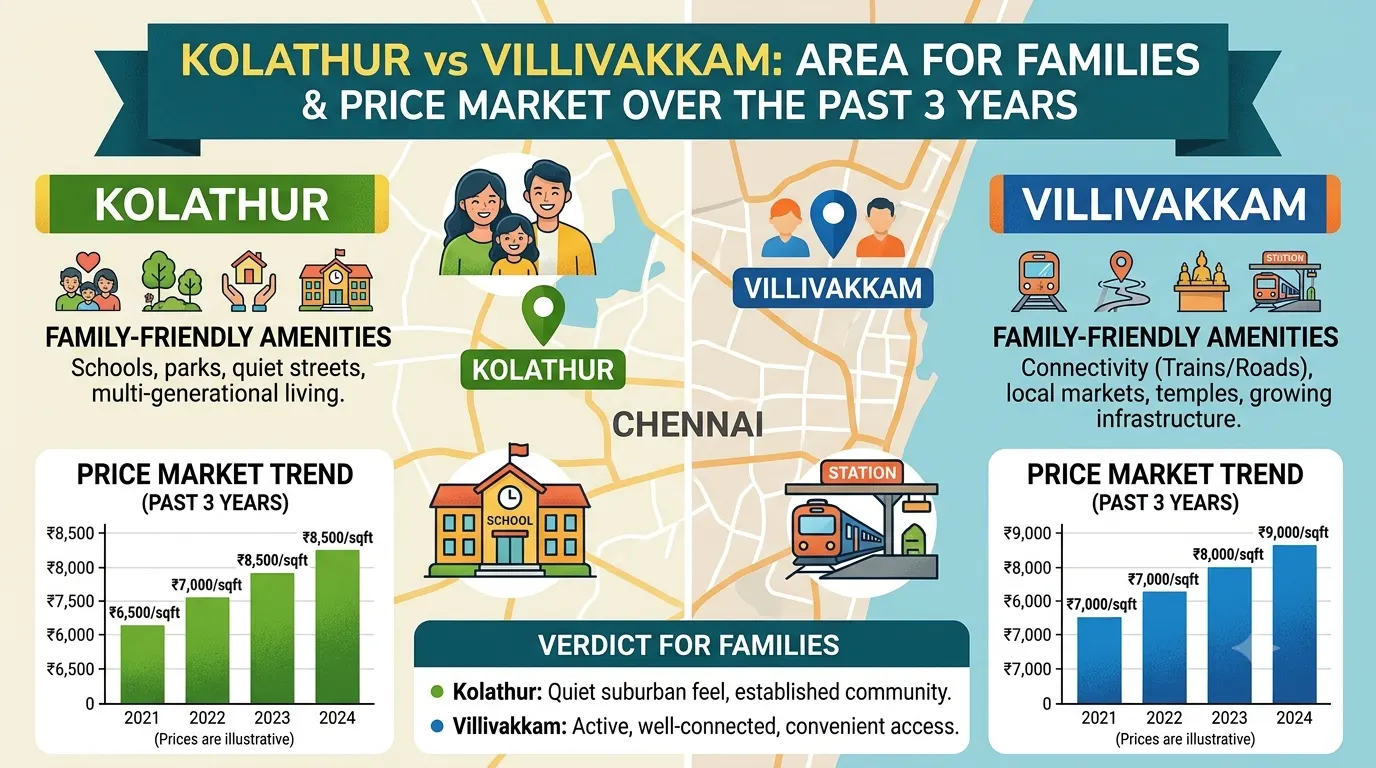
- Price band: Rs 6,500 – Rs 8,500/sq.ft
- Index insight: Sub-index of OMR with faster growth due to concentration of offices and large residential projects.
- Price behaviour: Faster appreciation than city average.
- Demand driver: Young workforce and first-time buyers.
Overall insight (IT corridor):
Property prices here are employment-sensitive, making the index more growth-oriented than traditional areas.
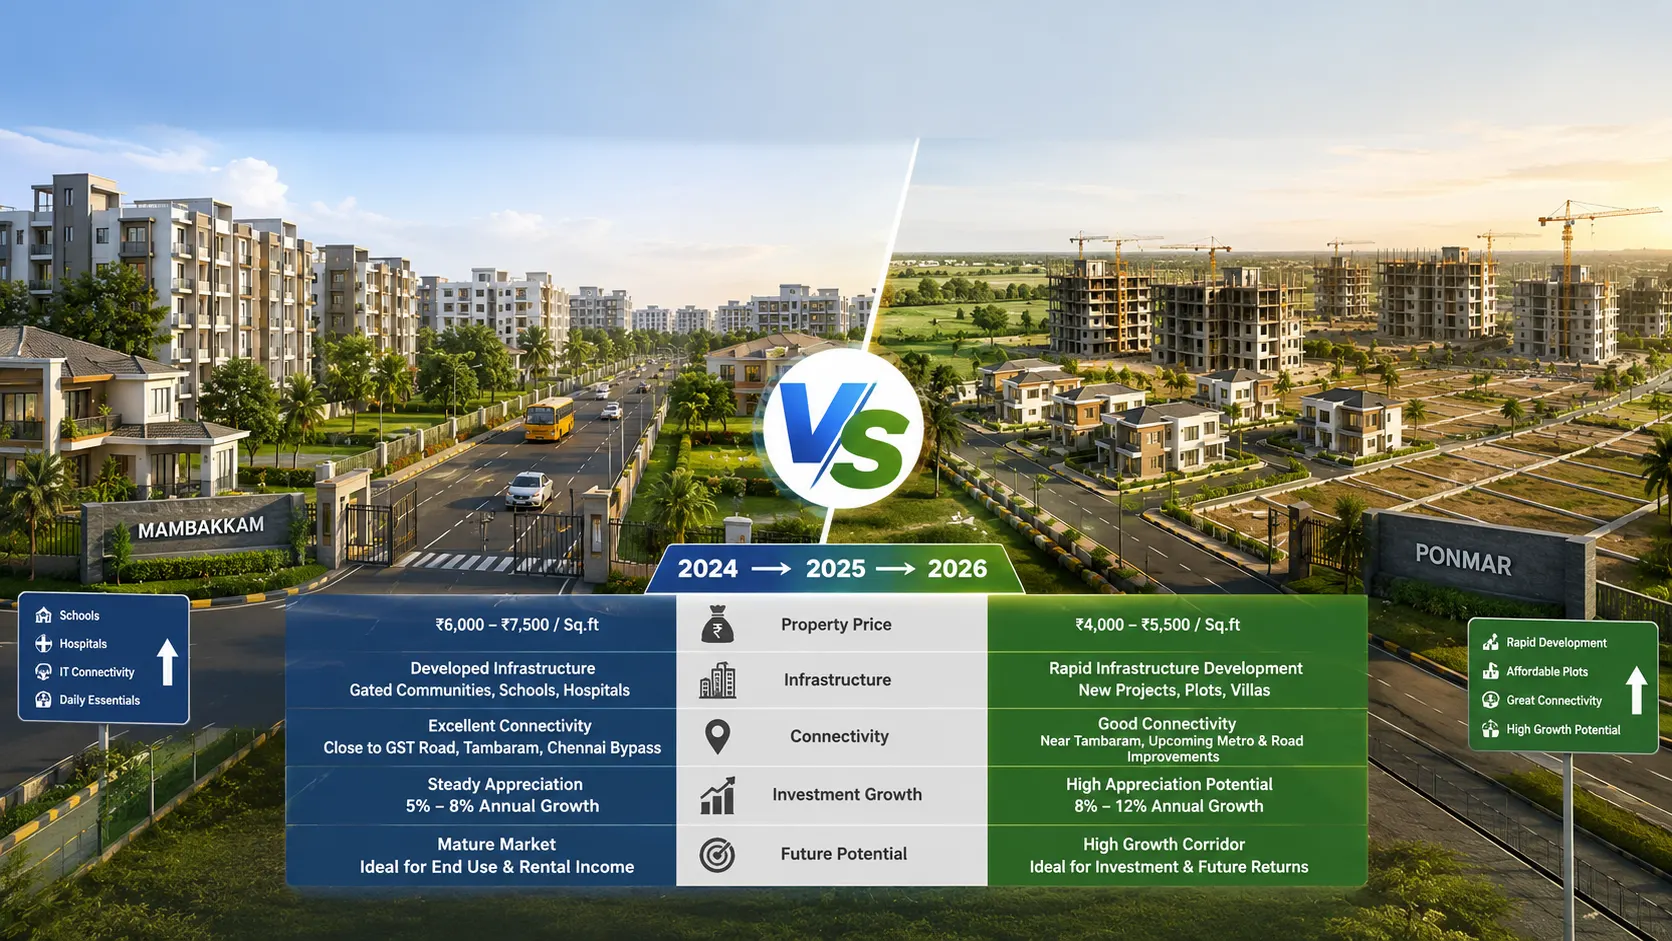
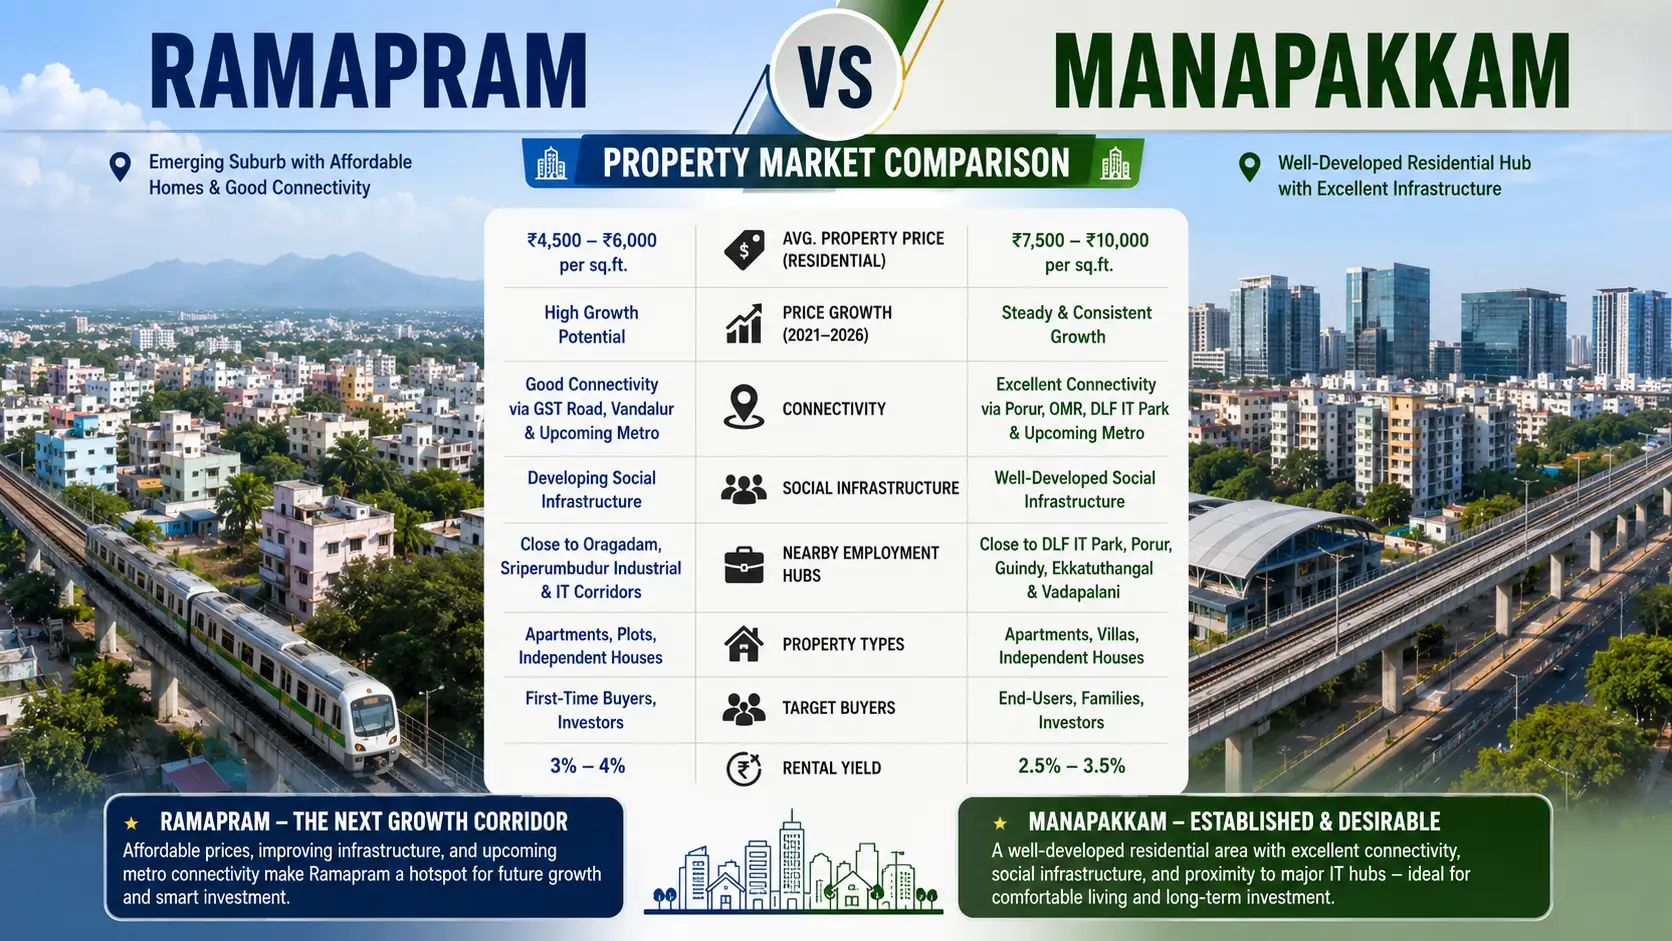
4. Affordable & Peripheral Suburban Localities
- Price band: Rs 4,500 – Rs 7,000/sq.ft
- Index insight: Lower base index but improving steadily due to rail, road, and metro connectivity.
- Price behaviour: Slow but consistent appreciation.
- Demand driver: First-time buyers and salaried middle-income groups.
- Price band: Rs 4,500 – Rs 6,500/sq.ft
- Index insight: Entry-level pricing with long-term growth orientation.
- Price behaviour: Incremental increases tied to infrastructure expansion.
- Demand driver: Budget buyers and long-term residents.
Overall insight (suburbs):
These areas have a low price index today but represent future-oriented growth zones.
Key Index-Level Takeaways
- Chennai’s property price index shows wide locality-based variation, from Rs 4,500 to Rs 22,000+ per sq.ft.
- Core city areas = high index, low volatility.
- IT and growth corridors = mid index, higher appreciation momentum.
- Peripheral suburbs = low index, infrastructure-led gradual rise.
- Overall market behaviour is stable, end-user dominated, and less speculative compared to other metros.
https://www.livehomes.in/live_insights